Data Science Project
Netflix Data
Analysis.
Deep dive into Netflix's content library analyzing 8,800+ titles, exploring trends, genres, and global content distribution patterns.
0+
Titles Analyzed0+
Countries0
Genres0
Latest DataBuilt with: Python
 Pandas
 Matplotlib
 numpy
PythonPandasMatplotlibnumpyDiscoveries
Key Insights.
Content Distribution
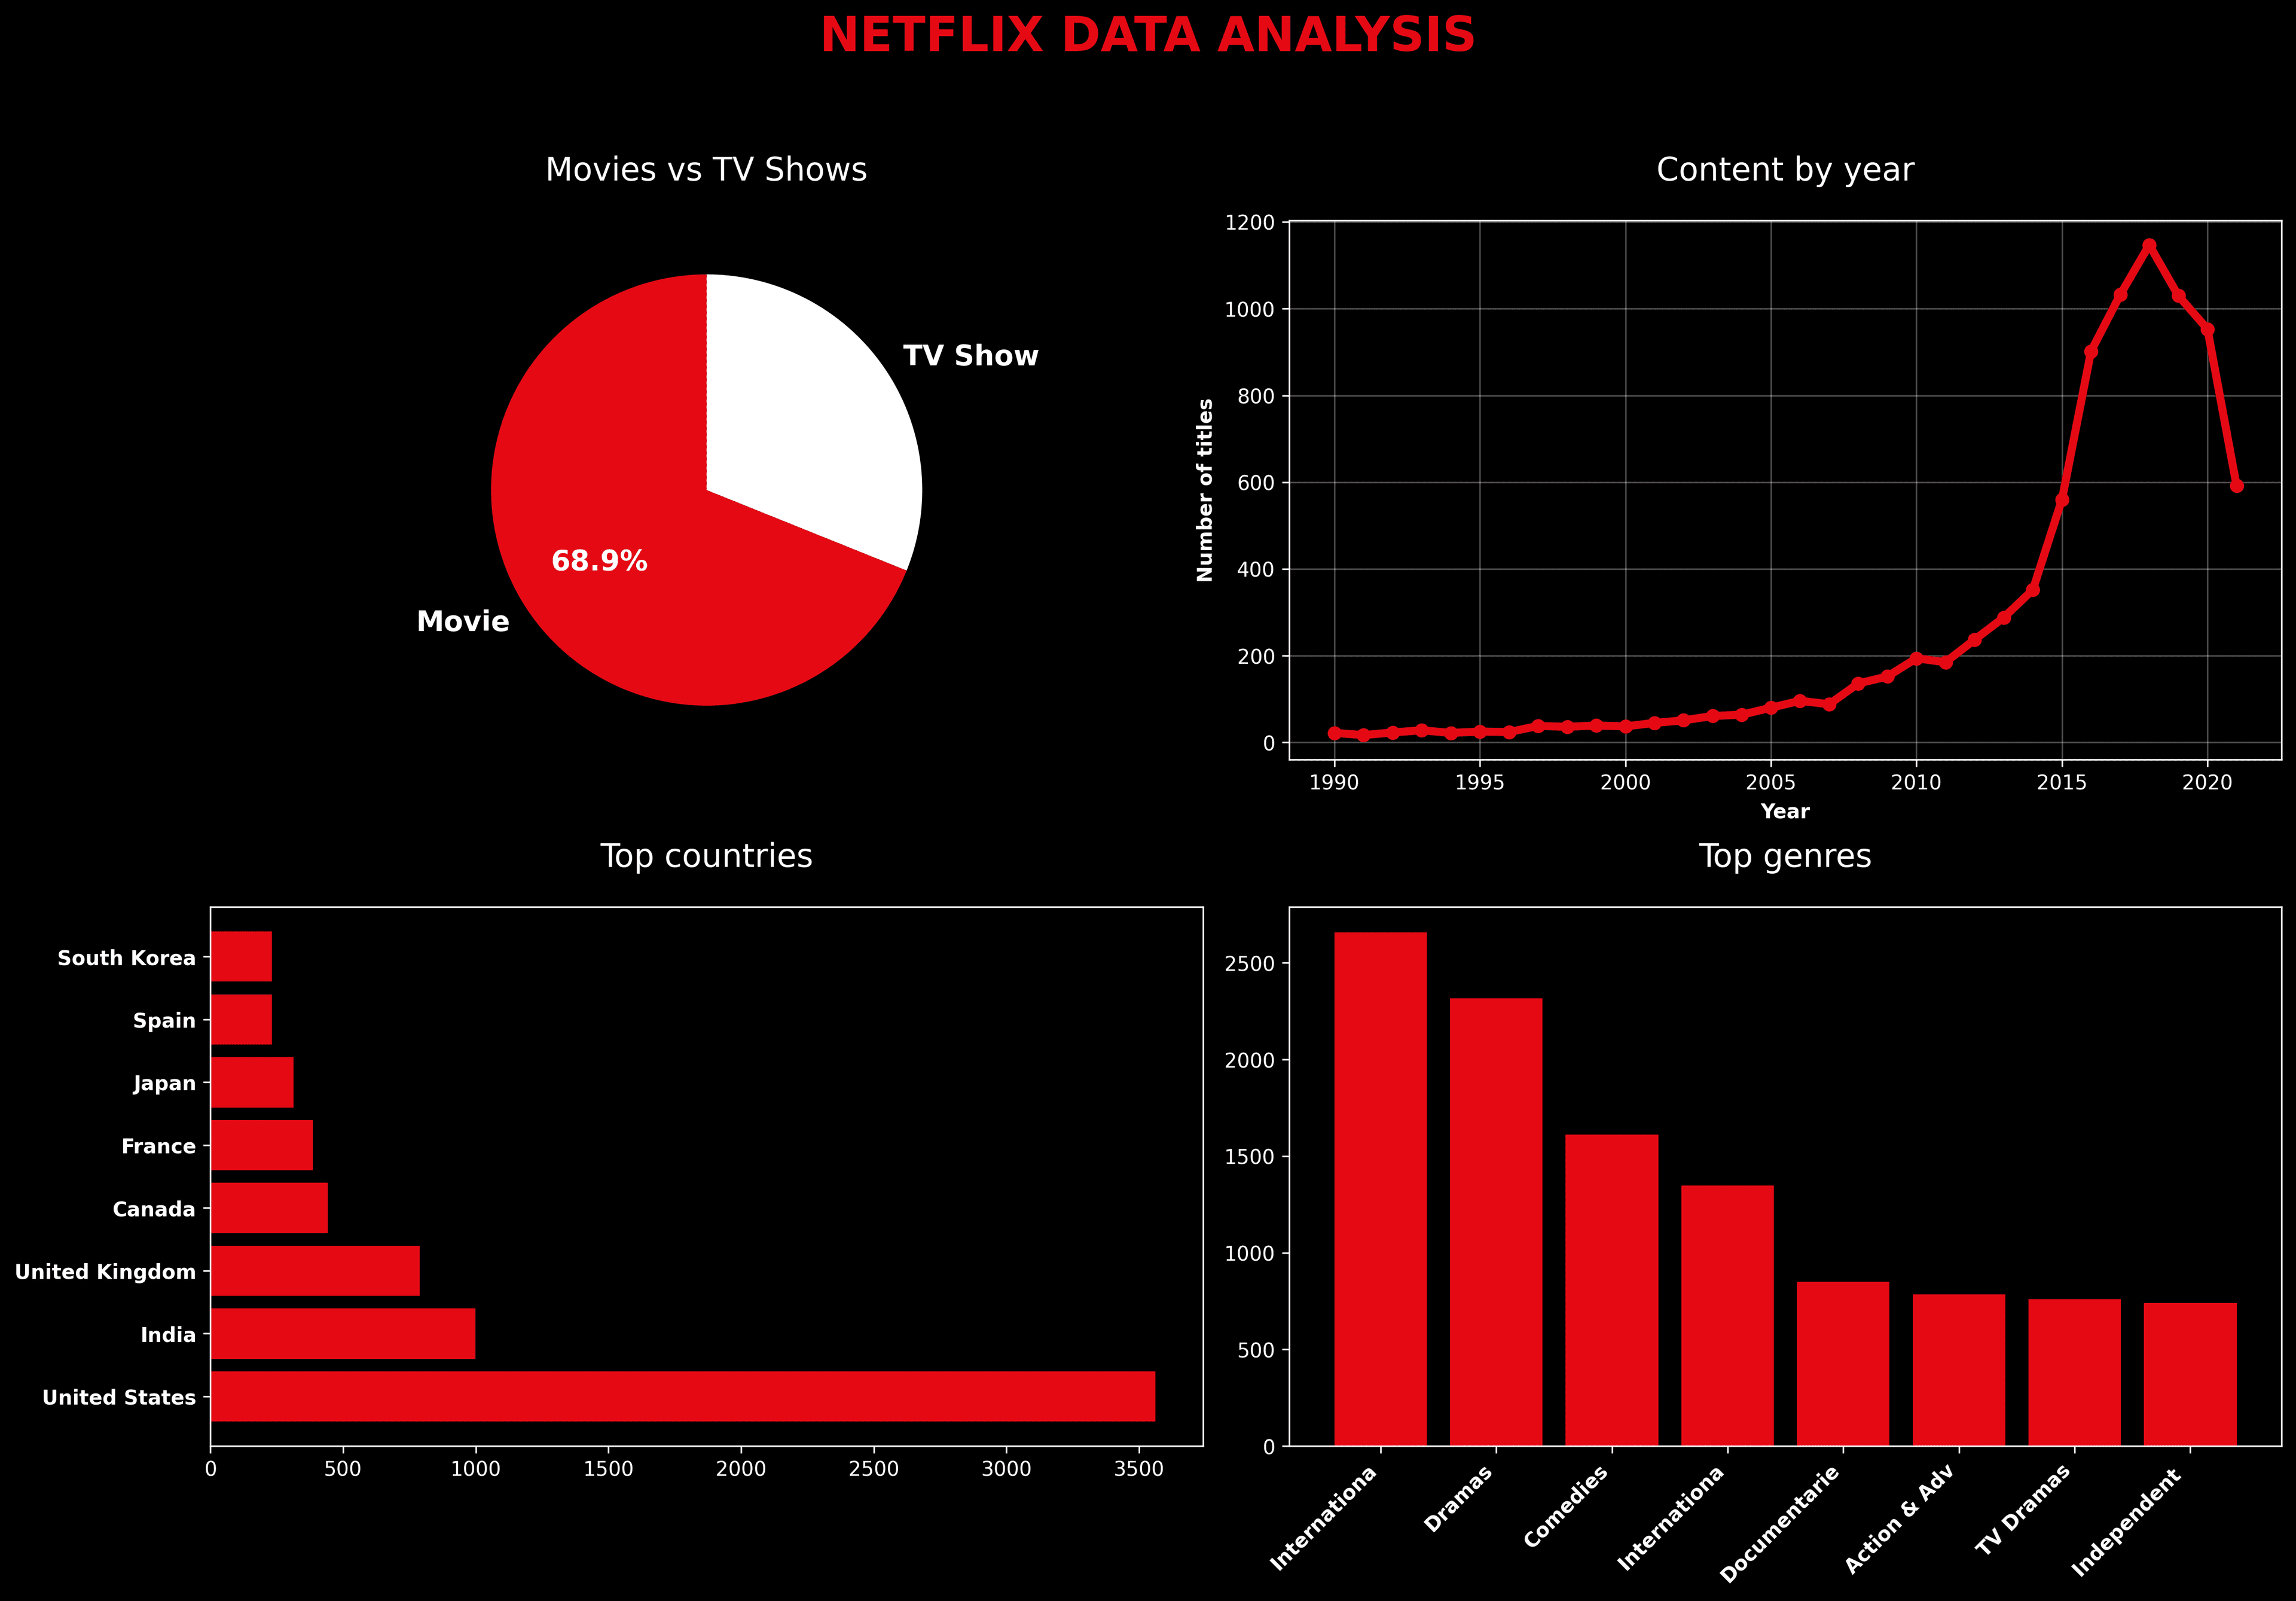
Movies dominate the catalog with ~70% of total content, while TV shows make up the remaining 30%.
Growth Trends
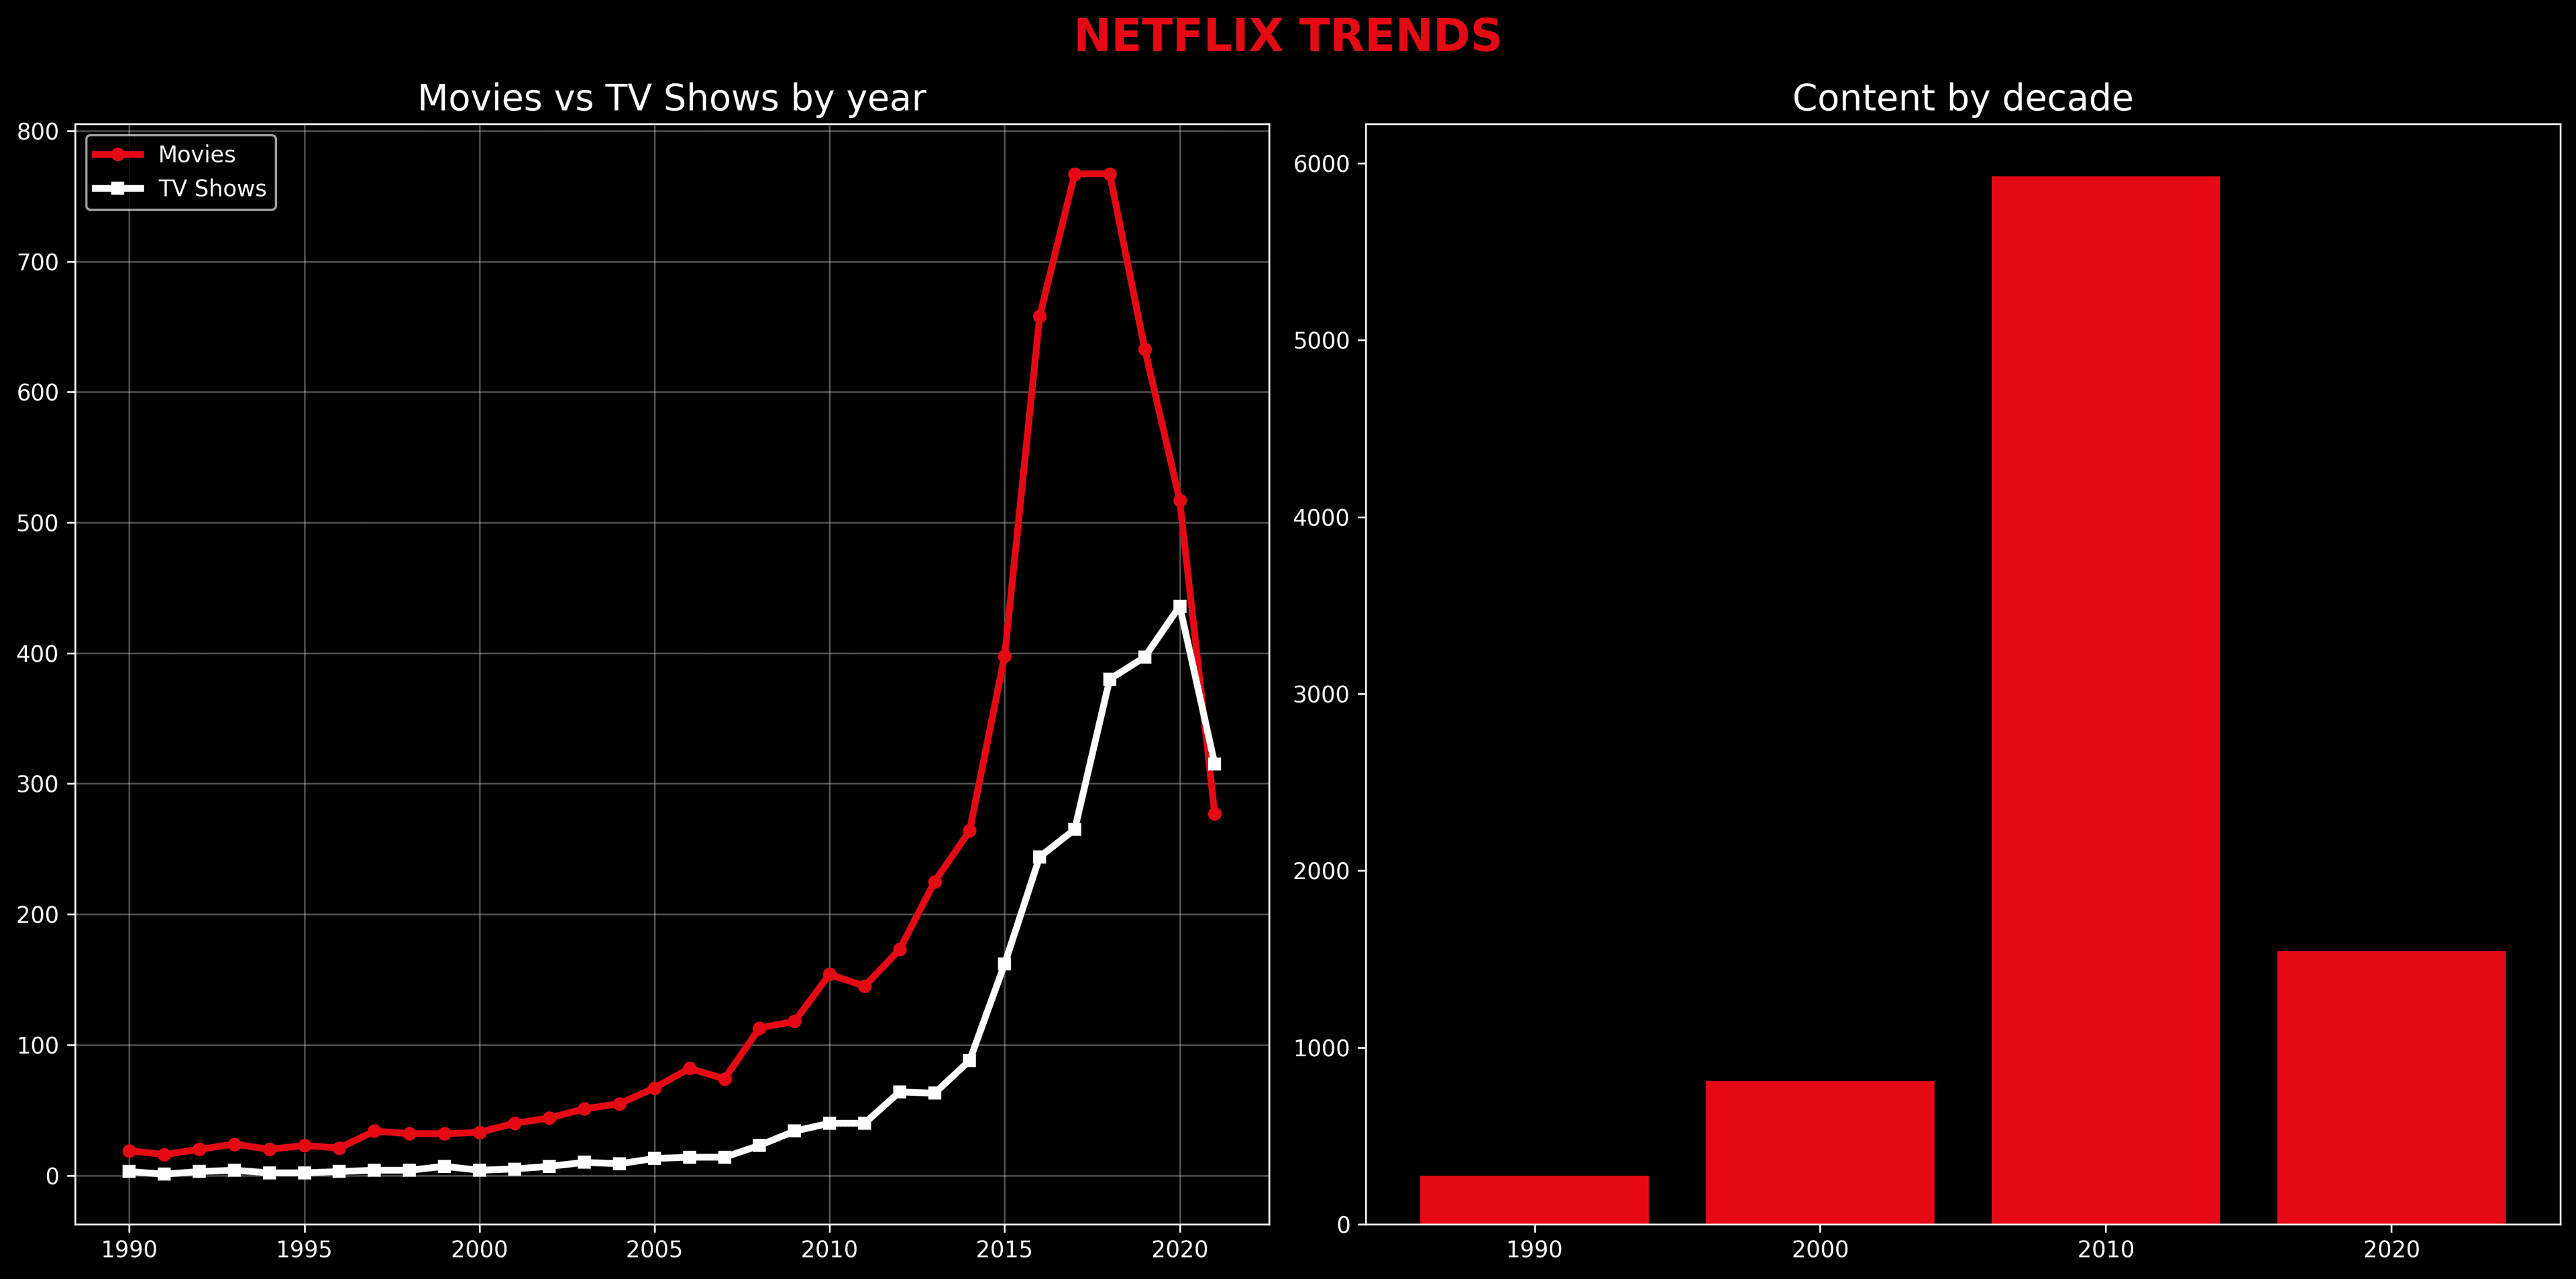
Massive content growth from 2010-2017, with a noticeable shift towards international productions.
Global Reach
Content from 190+ countries, with USA, India, and UK being the top content producers.
Visualizations
Data Stories.
Overview Analysis
Content distribution and composition
Trends Analysis
Content growth and temporal patterns
Explore the Code.
Dive into the Python scripts, Jupyter notebooks, and data processing pipeline used to create these visualizations.